
Contents
- From Sources to Data: The Challenges and Advantages of Thinking in Terms of Data
- From Data Entry to Data Modeling
- Building a Database with nodegoat
- Conclusion
- References
From Sources to Data: The Challenges and Advantages of Thinking in Terms of Data
A crucial but often challenging first step for humanities researchers when developing data-driven projects is conceptualizing sources in terms of data and organizing them into a database — a structured format that is programmatically searchable and analyzable. This lesson will therefore begin by reviewing the conceptual challenges as well as advantages of thinking in terms of data. It will then guide readers through the process of transforming sources into data by first outlining core principles of data modeling and then demonstrating how these can be put into practice to build a database using nodegoat.
Transforming Research Objects into Data
When taking their first steps in the world of digital humanities, humanities researchers may face a number of challenges. Often these are technical in nature: using digital tools is not always straightforward, and gaining proficiency in a method, a piece of software, or a programming language often requires extensive and sometimes painstaking practice. There is also, however, a challenge of a different kind that is just as complex: learning how to conceptualize your research in terms of ‘data’.
But what do we mean when we talk about ‘data’? Generally speaking, we can define data as information that is structured into discrete units and lends itself well to automated processing. This way of structuring information ensures that when the same operations are applied, they consistently yield the same results.
Transforming a research object into data involves some translation work: we must translate our information from its original form to a structured format. Data, in contrast to what its etymology might lead us to believe, is not a ‘given’ at all: it is not simply there, waiting to be collected. On the contrary, data is the product of interpretation and transformation. In order to transform their sources into data, researchers must read their sources with a defined set of research questions in mind, extract the relevant information, and record it in a structured format.1
Those who do research in the humanities often encounter difficulties at this stage, because the very notion of ‘data’ does not clearly align with disciplinary practices in these fields. In history, anthropology, or literary studies, we think of the phenomena we study in flexible, open-ended, and uncertain terms. We are accustomed to reflecting on the researcher’s subjectivity and placing contingency at the center of our analyses. We analyze political, social, and cultural phenomena as complex objects that are difficult to reduce to a ‘dataset’. As Miriam Posner described in her 2015 lecture, “Humanities Data: A Necessary Contradiction”:
[H]umanists have a very different way of engaging with evidence than most scientists or even social scientists. And we have different ways of knowing things than people in other fields. We can know something to be true without being able to point to a dataset, as it’s traditionally understood.2
Thus, researchers in the humanities may find it counterintuitive to read their sources, documents, or ethnographic notes with the goal of extracting information and arranging it into the fixed, discrete, structured categories typical of a spreadsheet. This process may even appear too simplistic and reductive: how can a political tradition, the affective dimension of a local cultural practice, the conceptual issues of modern philosophy, or the psychology of a literary character be translated into ‘data’?
However, thinking about our research in terms of data does not necessarily need to lead to a simplification or flattening of the object of study, as demonstrated by the new wave of projects in quantitative history, which appears to be making a strong comeback. This research shows that it is possible to adopt a data-driven methodological approach while allowing for complexity and subjectivity. As Johanna Drucker, a scholar of graphic design, reminds us, data cannot be separated from the act of collection that produced it; rather, interpretation is always involved in the effort to capture, select, and carve this data from reality. In other words, “all data is capta” (not given, but taken).3
For his part, the historian Manfred Thaller emphasizes that data can represent reality, but only when it arises from an act of interpretation. Thaller proposes a hierarchical schema that distinguishes between ‘data’, ‘information’ and ‘knowledge’. Data consists of symbols that can be arranged in a system of representation. This system produces information when the data is interpreted within a defined context. Knowledge, in turn, emerges from information that leads to decision-making or action.4
The Affordances of Approaching Research Sources as Data
Recognizing both the complexity and the structured nature of data allows us to see the advantages of conceptualizing our research in terms of data.
First, transforming our sources into data allows for automated digital processing and quantitative analysis. This is particularly useful when our research involves large volumes of information or when we can derive datasets directly from our sources (for example, inventories, demographic data, etc.).
In addition, the very process of translating our sources into data requires us to clearly and precisely define the elements of our investigation, including our hypotheses and research questions. This brings a conceptual advantage in the sense that it compels us to formalize the objects of our research, the relationships between them, as well as the nature and consequences of their interactions.
Finally, structuring information in a database allows us to easily share it with the broader scholarly community.
In this lesson, we will discuss the challenges that newcomers to digital research are likely to encounter when designing a database for use in humanities scholarship. We will therefore:
- Introduce key concepts and technical tools needed to design a data model
- Walk through the first steps in building a database using the online platform nodegoat
In doing so, we hope to demonstrate the advantages of a research method whose logic may not be immediately evident to researchers trained in the humanities.
From Data Entry to Data Modeling
As mentioned earlier, the further we examine our sources, the more our research can generate substantial amounts of information. In such cases, it is often preferable to catalog this information in an organized and structured manner. For example, let’s imagine that we are conducting historical research on a set of books: a hypothetical project about the works produced by dissident writers from the communist regimes of Eastern Europe.
Tabular Data Entry
We could record information about these books in a simple format using the features of a spreadsheet, such as this one:
Basic Table
| Title | Place of Publication | Author |
|---|---|---|
| The Gulag Archipelago | Paris | Aleksandr Solzhenitsyn |
| Life and Fate | Geneva | Vasily Grossman |
| The New Class | New York | Milovan Djilas |
| The Captive Mind | Paris | Czesław Miłosz |
| Cogs in the Wheel | Paris | Michel Heller |
| The Intellectuals on the Road to Class Power | Brighton | George Konrad, Iván Szelényi |
This three-column table is an initial data entry which allows us to visualize our information very simply. We are already starting to build, in a rather elementary way, what could become a dataset. Each row in the table represents an ‘instance’, or a ‘record’, and each column represents a ‘characteristic’, or an ‘attribute’, of these instances. Here, these characteristics are the title, the place of publication, and the author of each work.
For now, this tool is sufficient because we are using it to store just a small amount of information. But imagine that, as we delve deeper into our inquiry, we begin to examine the works and their authors in more detail, thereby increasing the amount of recorded information. We could then expand the table, for example, as follows:
Expanded Table
| Title | Place of publication | Language of the first edition | Date of publication | Publishing house | Founding date of the publishing house | Author | Nationality of the author | Place of birth of the author | Date of birth of the author |
|---|---|---|---|---|---|---|---|---|---|
| The Gulag Archipelago | Paris | French | 1973 | Le Seuil | 1930 | Aleksandr Solzhenitsyn | Russian | Kislovodsk | 1918 |
| Life and Fate | Geneva | French | 1980 | L’âge d’homme | 1955 | Vasily Grossman | Russian | Berdychiv | 1905 |
| The New Class | New York | English | 1957 | Praeger | 1950 | Milovan Djilas | Montenegrin | Podbišće | 1911 |
| The Captive Mind | Paris | English | 1953 | Instytut Literacki | 1946 | Czesław Miłosz | Polish | Šeteniai | 1911 |
| Cogs in the Wheel | Paris | French | 1985 | Calmann-Lévy | 1920 | Michel Heller | Russian | Mogilev | 1922 |
| The Intellectuals on the Road to Class Power | Brighton | English | 1979 | Harvester Press | ? | George Konrad, Iván Szelényi | Hungarian, Hungarian | Berettyóújfalu, Budapest | 1933, 1938 |
Thanks to this new table, we can now cross-reference more information and go into more depth in our analysis by querying the relationships between various attributes of the works, the publishing houses, and the authors. We could, for example, formulate and test a hypothesis about whether Russian authors tend to publish more frequently in French, or ask whether certain publishing houses show a preference for authors of a given age or nationality.
However, the more records we analyze and the more questions we ask, the more the information accumulates, which makes this table increasingly difficult to use. In some cases, the information itself is complex. For example, the book The Intellectuals on the Road to Class Power has more than one author. Its publishing house, Harvester Press, has no known founding date (since information about this small English publisher is rather limited). This is a classic example of the uncertainty that often characterizes research in the humanities. As a result, it becomes increasingly difficult to read, cross-reference, and interpret all of this information.
When this happens, it is often more useful to start thinking about the ‘relationships’ that connect the different objects of our research and to build a table that represents them – a data table – before gathering them into a database.
From Spreadsheets to Databases
What is a ‘database’? Generally speaking, it functions as a container that organizes information according to a certain structure. More specifically, as Georges Gardarin writes, a database is “a dataset modeling the objects of a part of the real world and serving as a support for a computer application”.5 The data in a database must be ‘searchable’: we must be able to find all the data that satisfies a certain criterion (such as, in our case, all the authors of Russian nationality, or all the works published in French). It is this searchability that makes the database a powerful tool for exploring and analyzing information.
In this lesson, we will focus on a specific and fairly common type of database: the relational database. A relational database (referred to hereafter simply as ‘database’) is structured as a set of tables linked in such a way that information can circulate between them. These tables within the database typically contain two key types of elements: objects and the relationships between them. Each object represents a complex reality defined by many characteristics (the ‘attributes’ in the columns) that are expressed in specific instances (the ‘records’ in the rows).
Before we can build this database, we must first define the objects, the attributes they contain, and the way in which they are connected to one another. This process is known as creating a data model.
In our example, we have identified three objects of interest: works, publishing houses, and authors. How are they connected? The answer will depend mainly on our research questions. In the example proposed here, if our focus is on the book as an object of circulation, we can imagine a basic graph linking the work, the author, and the publishing house in this way:
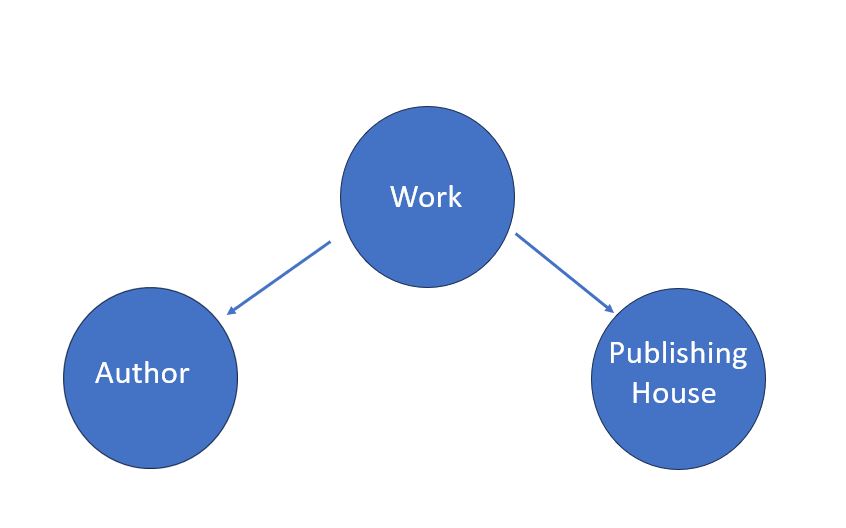
Figure 1. A logic diagram representing the relationships between works, publishing houses, and authors.
This diagram corresponds more or less to a ‘conceptual data model’5 representing the entities that interest us and the relationships that connect them. Here, each work is linked to a specific author who wrote it and to a specific publishing house that published it.
At this point, we should ask ourselves the following questions we’ve already touched upon:
- What information does each object contain?
- What elements is each object composed of?
- How exactly are these objects connected to one another?
Our answers will depend on the respective attributes of each object. Based on the table we created above to catalog information for our hypothetical research question, we can define our objects through the following attributes and relationships:
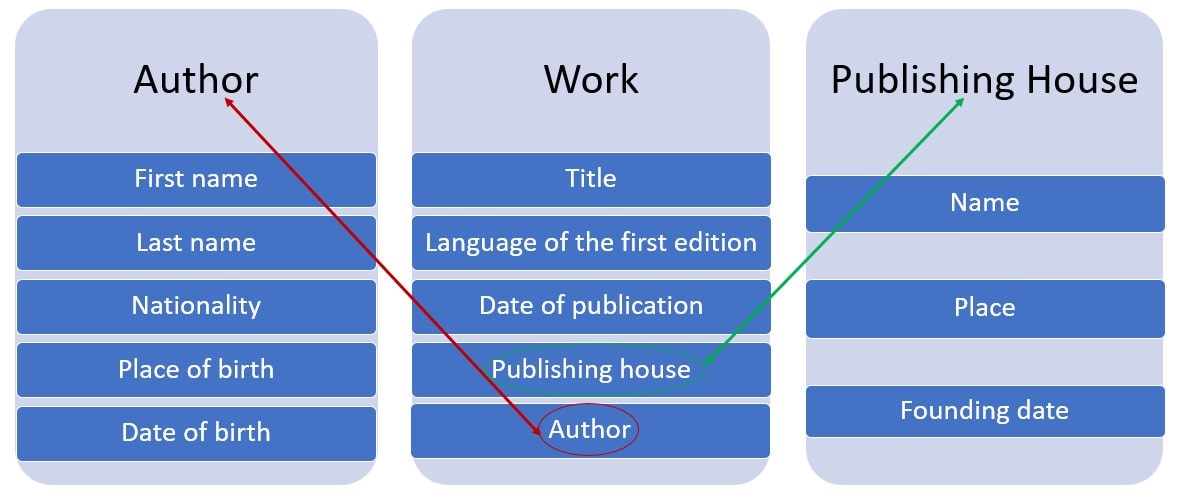
Figure 2. Our data model showing objects, their attributes, and their relationships.
This now corresponds to what is generally called a ‘logical data model’, which allows us to more clearly define our objects and their relationships and, thus, to implement the conceptual model. Based on this diagram, we can create tables to record the characteristics of each object separately:
Table 1: Works
| Title | Language of the first edition | Date of publication | Publishing house | Author |
|---|---|---|---|---|
| The Gulag Archipelago | French | 1973 | Le Seuil | Aleksandr Solzhenitsyn |
| Life and Fate | French | 1980 | L’âge d’homme | Vasily Grossman |
| The New Class | English | 1957 | Praeger | Milovan Djilas |
| The Captive Mind | English | 1953 | Instytut Literacki | Czesław Miłosz |
| Cogs in the Wheel | French | 1985 | Calmann-Lévy | Michel Heller |
| The Intellectuals on the Road to Class Power | English | 1979 | Harvester Press | George Konrad, Iván Szelényi |
Table 2: Authors
| First name | Last name | Nationality | Place of birth | Date of birth |
|---|---|---|---|---|
| Aleksandr | Solzhenitsyn | Russian | Kislovodsk | 1918 |
| Vasily | Grossman | Russian | Berdychiv | 1905 |
| Milovan | Djilas | Montenegrin | Podbišće | 1911 |
| Czesław | Miłosz | Polish | Šeteniai | 1911 |
| Michel | Heller | Russian | Mogilev | 1922 |
| George | Konrad | Hungarian | Berettyóújfalu | 1933 |
| Iván | Szelényi | Hungarian | Budapest | 1938 |
Table 3: Publishing houses
| Name | Place | Founding date |
|---|---|---|
| Le Seuil | Paris | 1930 |
| L’âge d’homme | Geneva | 1955 |
| Praeger | New York | 1950 |
| Instytut Literacki | Paris | 1946 |
| Calmann-Lévy | Paris | 1920 |
| Harvester Press | Brighton | ? |
We have now organized this information into three tables that represent our dataset. In order to be able to navigate between these tables and follow the relationships established in the data model diagram, we would need to connect them. To do so, we need to define both the possibilities and constraints of these relationships, what is termed cardinality.6
When building a relational database, we must carefully consider the types of relationships that can exist between tables: is each element in one table linked exclusively to a single element in another table, or does it have multiple and intersecting relationships (that is, can it be connected to multiple entries across tables)?
In our example of the relationships between authors and works, does each work have only one author (cardinality 1,1)? Or can it have two or more, as is the case with The Intellectuals on the Road to Class Power (cardinality 1,N)? Conversely, could each author of a work written by multiple authors also be the author of multiple other works (cardinality N,N)? These are the kinds of questions that inevitably arise during the process of building a database.7 The answers will depend on our specific dataset. In the next section, we will see how to put all of this into practice.
Building a Database with nodegoat
Relational databases can be built using specialized software known as database management systems (DBMS), which allow users to query and manipulate data according to the principles of the SQL query language. There are many DBMS available, both open-source (e.g., Amazon Aurora DSQL, PostgreSQL, MariaDB) and proprietary (e.g., Microsoft Access, Oracle Database).
However, DBMS software can quickly become difficult to use. That is why we will make use of nodegoat: an online platform which is specifically designed to support humanities researchers in building and working with relational databases.
As we will see, nodegoat allows us to design a data model in a flexible way, to manage and store data online, to incorporate historical information with some degree of uncertainty, to export and import this data in a simple way, and, lastly, to produce visualizations, such as maps or networks.7
Getting Started with nodegoat
nodegoat, created and maintained by LAB1100, is an online platform that enables users to model, build, and share their databases in a relatively intuitive way. This lesson was designed using version 7.3 of nodegoat, but it is confirmed to work just as well with version 8.2, which was current at the time of original publication.8
Before getting started, you will need to request an account to use nodegoat online by filling out a simple form with your name, email address, institutional affiliation, and a brief description of your project. Note that the account registration may take up to 48 hours before it is ready to use.
nodegoat is an open-source, free to use online platform. It can also be installed locally, although this requires more advanced computer skills. Regardless of whether you use the online version or a local installation, access to more advanced features, such as working on multiple projects or collaboratively with others, requires one of the paid subscription options offered by LAB1100 - the organization that developed the platform.
The instructions that follow are intended to guide you through the workflow of creating a database with nodegoat according to the principles introduced in the first part of this lesson. The software’s design closely reflects the approach to modeling research described above: it treats people, groups, and things as objects connected by various types of relationships.9 nodegoat also offers tools for relational analysis and for creating visualizations, such as maps or networks. Most importantly, the platform accommodates uncertain or ambiguous data, which is common in humanities research. For example, it may suggest using a time interval if exact dates are not available, or draw a polygon when exact geographic coordinates are not known.
To be clear, the goal of this lesson is not to promote the exclusive use of nodegoat - you can certainly use other database management software tools and tutorials specifically designed for research in the humanities and social sciences. Related Programming Historian lessons provide more information on alternatives, including the introduction to Heurist by Vincent Paillusson (in French) and the introduction to MySQL by Jeff Blackadar. Additional tutorials include Ian Johnson’s overview of Heurist and the introduction to NocoDB by Robert Zwick and Julia Tolksdorf.
However, by combining all of these functionalities in a single environment, nodegoat significantly simplifies the process of modeling your research as data. nodegoat’s main advantage for us, in this lesson, is that it makes it especially easy to define and implement the data model we described in abstract terms above.
Setting Up Your Project in nodegoat
When you log in to nodegoat for the first time, you are shown your Domain (workspace) which is empty to start with and where you can see three tabs: Data, Management, and Model. In Model, you will build your data model following the rationale outlined in the previous section. In Management, you define the parameters for implementing this model. Finally, in Data, you categorize your data according to the structure defined by the model and examine it.
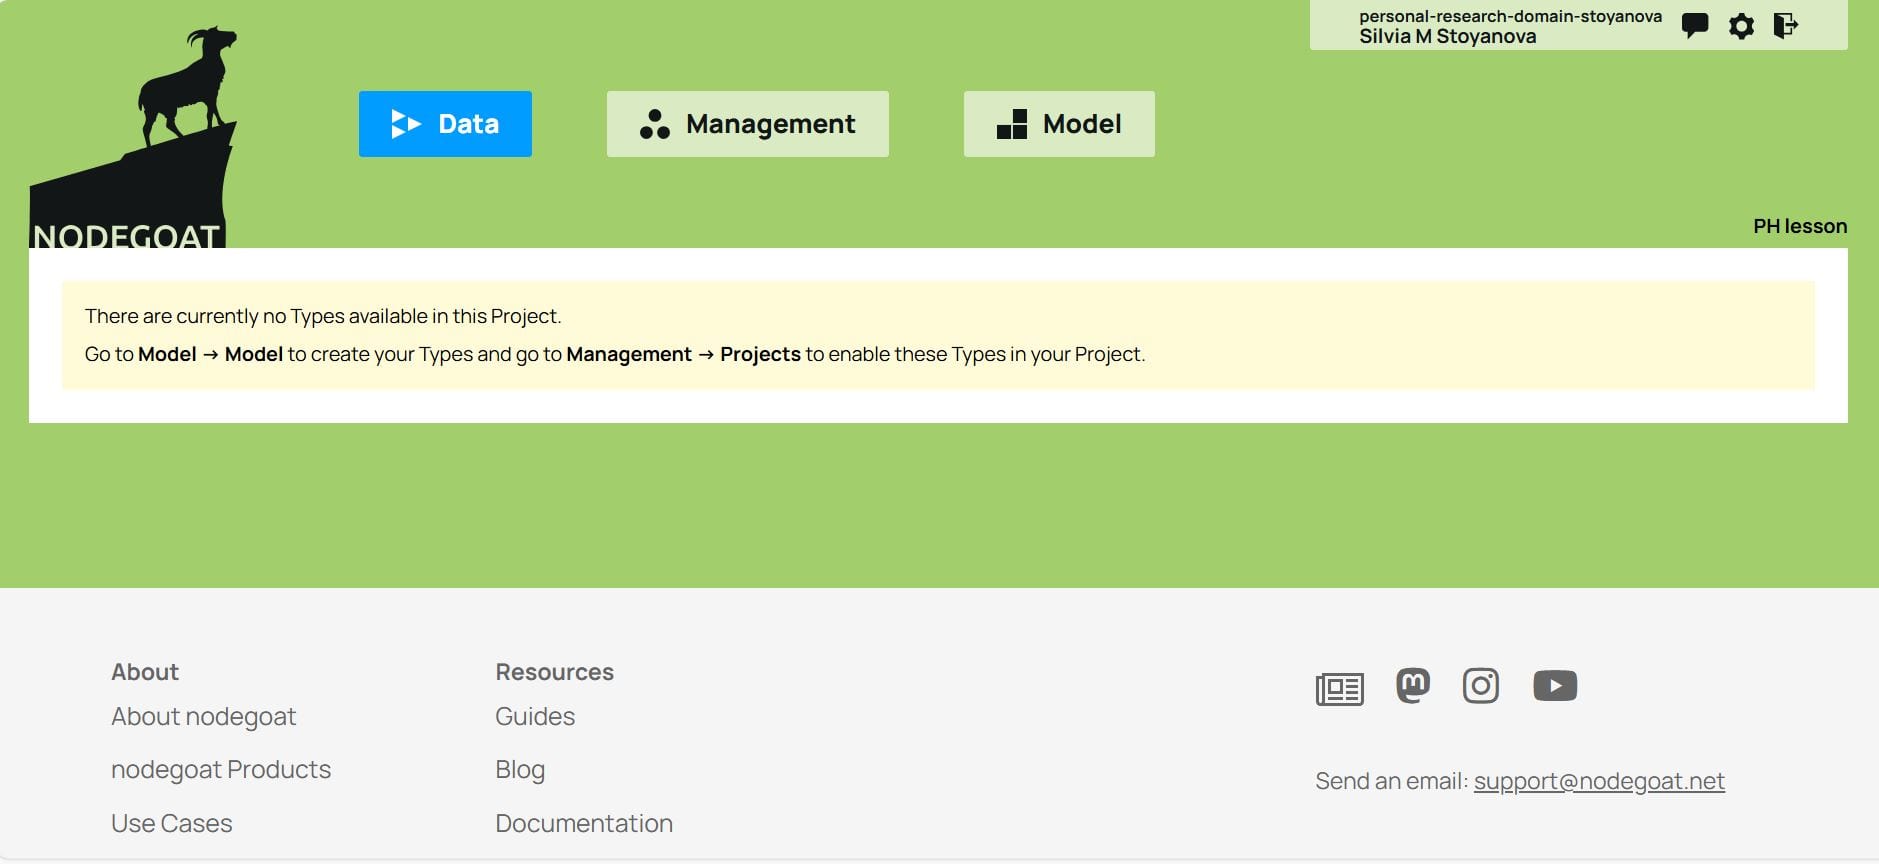
Figure 3. The empty nodegoat workspace before creating your project.
Defining the Objects of the Database
First, create the project from the Management tab by clicking on Add Project and typing its title, Works from the East, in the text box next to Project Name.
You then go back to the top level and click on the Model tab to define your data model. To start, you add an object type by clicking on the Add Object Type tab. As outlined in the previous section, the conceptual model defined here includes three object types: the work, the author, and the publishing house.
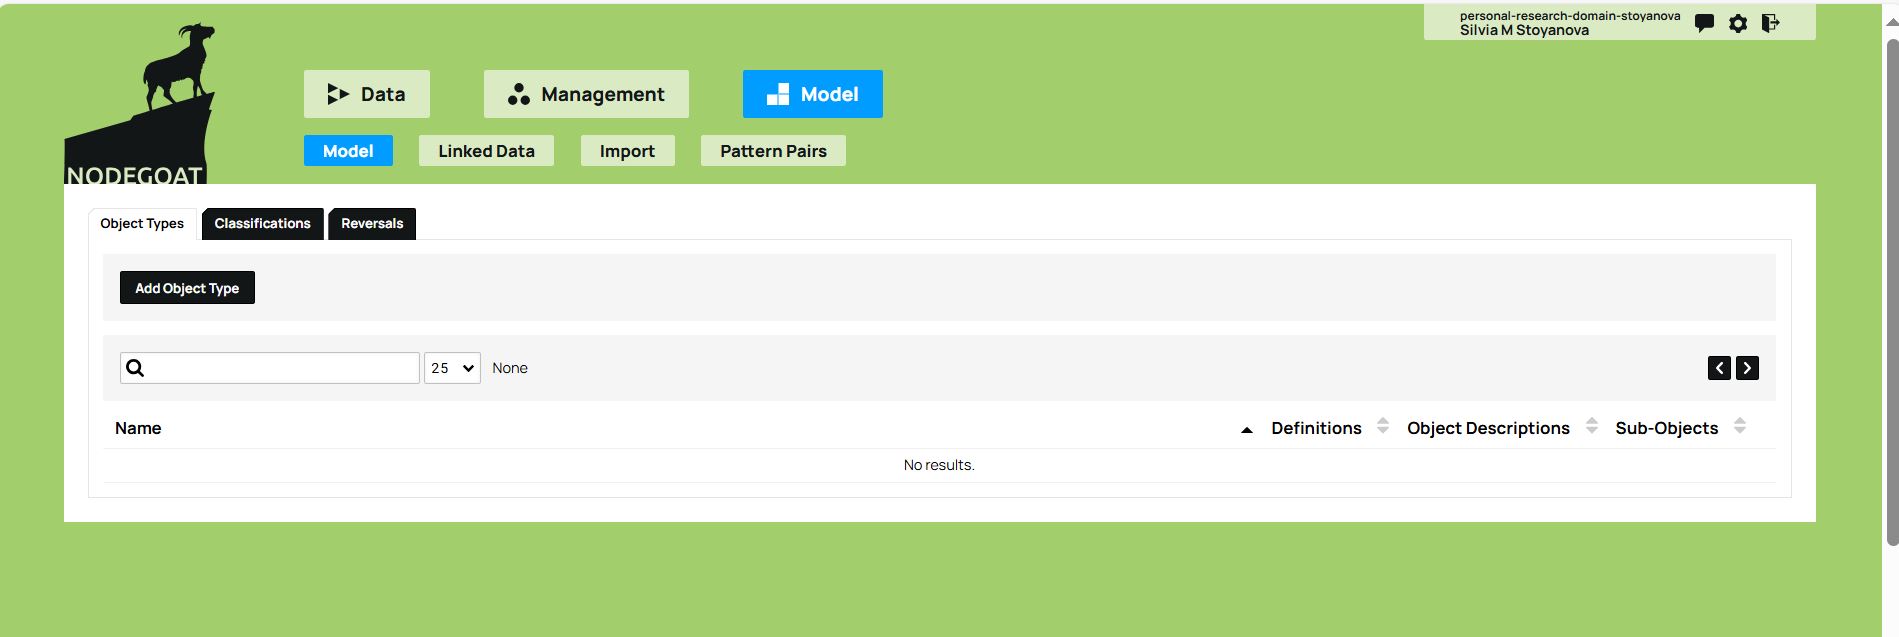
Figure 4. The Model tab and the Add Object Type option allows you to define your data model.
Under Name, you can enter the name of the first object type in the dataset (for example, Work) and under Descriptions you can define its attributes. The attributes of the Work object type are the title, the language of the first edition, and the date of publication. To add an attribute, click on the green add button. You must specify the type of value that each attribute takes: String (character string) for text values, such as the title of the work; Date for a specific format, like the date of publication, or other kinds of values depending on the nature of the dataset.
Be careful here: since the title of the work is included as an attribute in Descriptions, you must uncheck the Fixed Field option (which defines the object type according to the value given in Name), and instead check the Name box under the first attribute, i.e., the Title. The objects belonging to the Work type in the database will thus take the value given to the Title attribute. Once you have finished adding descriptions, click on the Save Object Type button below them, and the Work object type will appear at the bottom of the workspace that is activated by the Model tab.
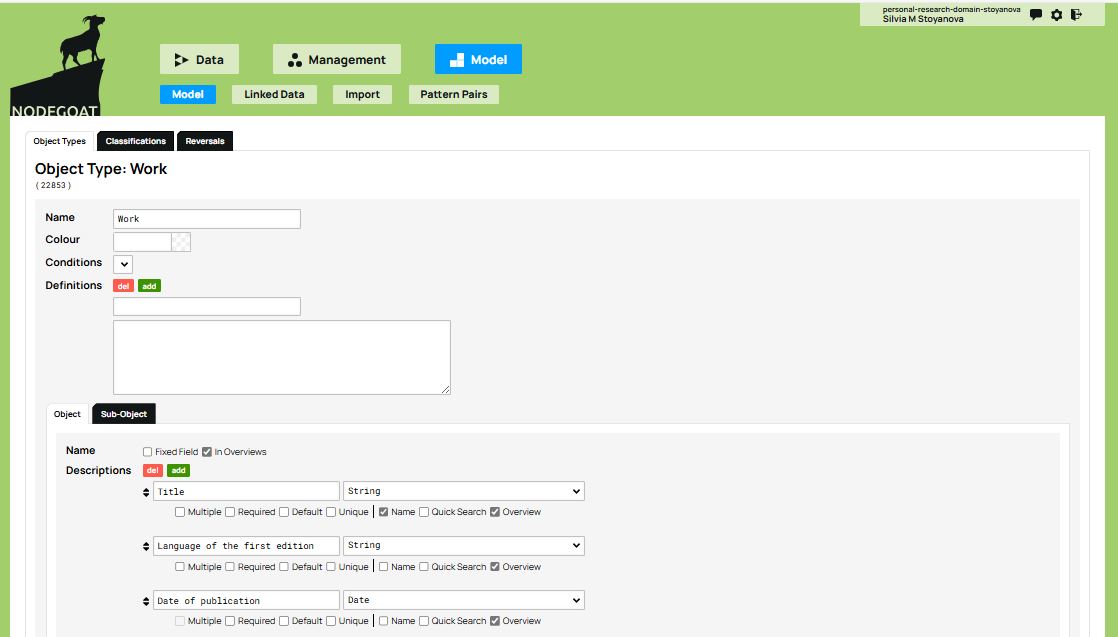
Figure 5. Define the first object type by selecting ‘Add Object Type’. Then, define its attributes using ‘Descriptions’.
You can now create the other two object types in the model, namely the Author and the Publishing House, following the same procedure. Under Name, define the name of the object type (i.e., Author, then Publishing house) and under Descriptions, its attributes.
As with the first object type, make sure to uncheck the Fixed Field option and instead check the Name box under the attribute which will serve as the object’s display name. For the Author, you can select the attributes First Name and Last Name, which are separate attributes in this example. In doing so, each author’s name will appear as a combination of these two values in the database overview.
For the Work, on the other hand, only define the Title attribute as the object’s Name. If you want to avoid having the database display the title of a work twice (once as the object’s name and again as the Title attribute), you can uncheck the Overviews option (located next to Fixed Field). This ensures that the database displays only the values selected under Name (in this example, the Title).
For the Publishing house, add the values defined in the conceptual model: name, city, and founding date.
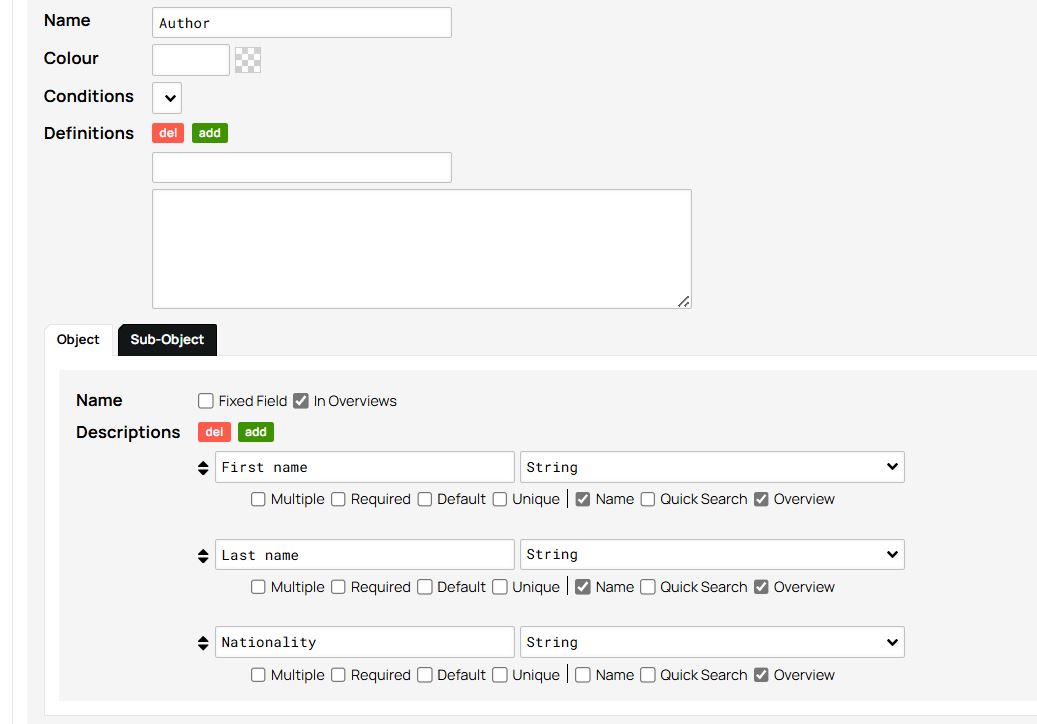
Figure 6. Choosing the attributes First name and Last name as the values of the object name Author.
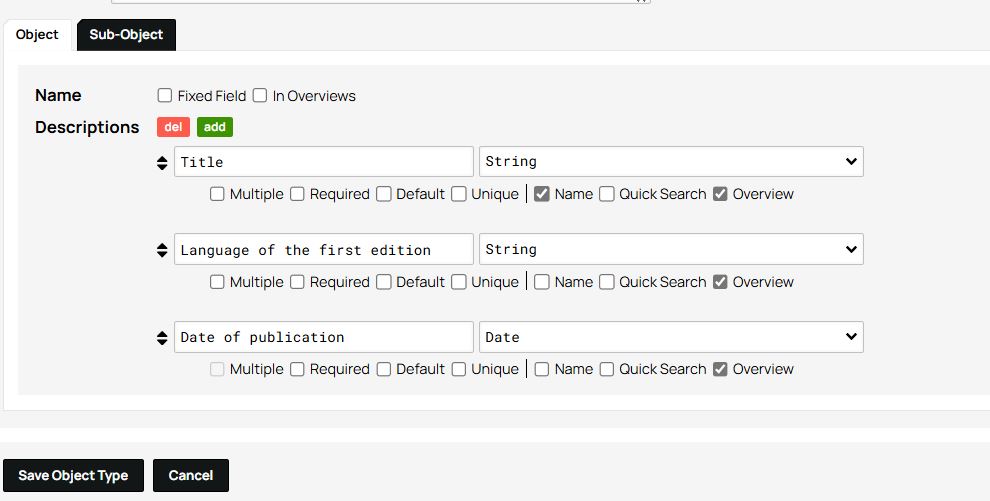
Figure 7. The Overviews option is left unchecked.
Next, you will select which object types you want to use in this project. This is an important step, because it is entirely possible to enter multiple object types into a database, but without using all of them or without exploring them in the same way, depending on the specific objectives of the project. To select your object types, navigate to the Management tab and click on the Edit option which appears on the right side of the project name.
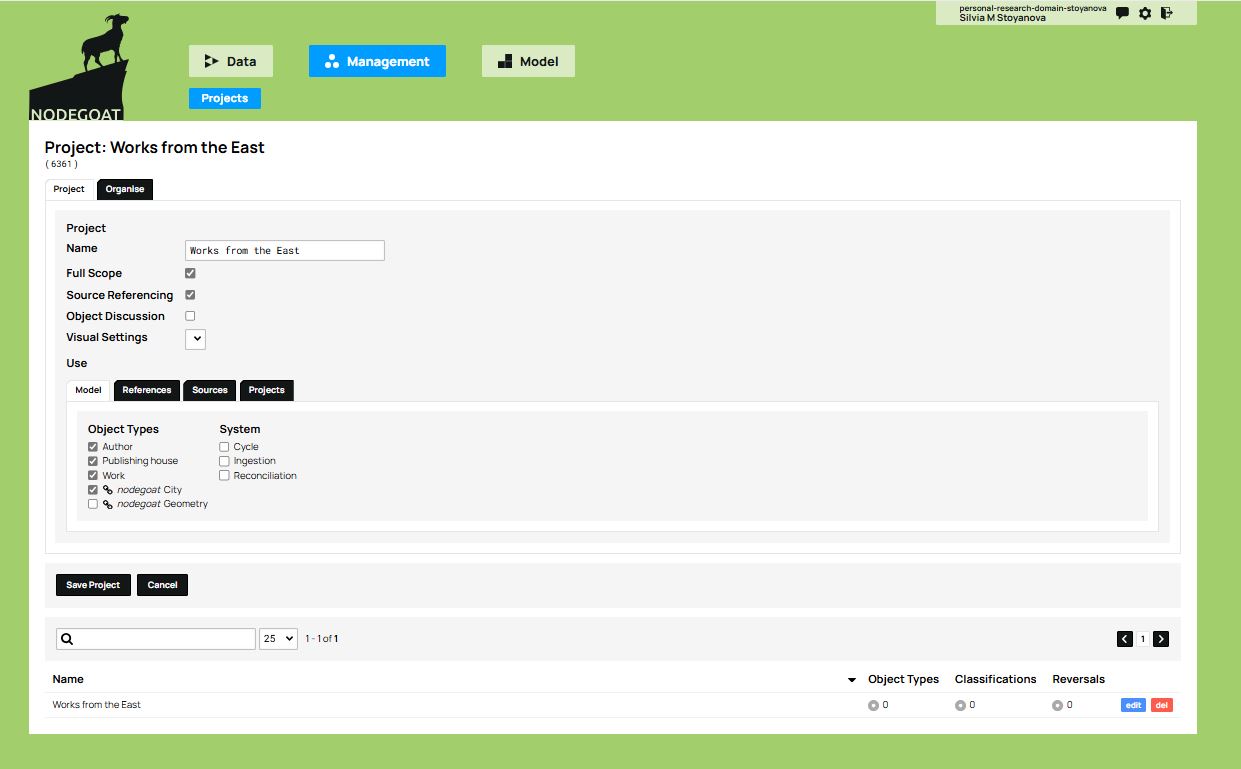
Figure 8. The Management panel allows you to organize the project and choose which objects will be used.
In addition to the objects you define, nodegoat offers two types of pre-set objects: ‘nodegoat City’ and ‘nodegoat Geometry’. You’ll notice that these pre-set objects appear below the three object types you created previously and can be selected by clicking on the corresponding checkbox.
Geometry is useful for representing regions, countries, or other political units of the past or the present. The City object type contains useful information about cities. The geospatial data (perimeter, geographic coordinates, etc.) for both these object types comes from external geographic databases, such as GeoNames, which are linked to nodegoat. These pre-set objects can be very useful and are readily available for implementation in your project to enrich the data model, and can in turn be supplemented further with your own research data.
For this project, you can select the City object type. In doing so, the software helps enhance the data model by adding a fourth object type to the initial three, along with a number of attributes that might not otherwise have been included (such as the country to which a city belongs).
After checking the box to select nodegoat City, click on the Save Project button at the bottom of the workspace.
Configuring the Database
There is still one fundamental step left to complete: to establish the relationships between the objects. Thus far, you have only provided information attached to a single object type at a time. However, the fundamental feature that this relational database offers is actually being able to link objects to one another. In the previous step, you selected which object types you want to use in this project in the Management panel. Now, you can go to the Model tab and connect each object type to the others. You can do this using the attributes of the objects which will function as ‘connectors’, as specified in the data model.
You can start with the Work object type. With the Edit button you can access the Object Types tab and the object attributes (Descriptions). In this example, there are two object types of particular interest: Author and Publishing house. The Author attribute will link the Work object type to the Author object type; the Publishing house attribute will link the Work object type to the Publishing house object type.
To establish these connections, you will add these two object types as attributes and select the value Reference: Object Type from the drop-down menu to the right of each attribute representing an object type (in our example, Author and Publishing house). When you do this, a new drop-down menu appears listing all of the object types in the model. You will then select Author and Publishing house respectively.
The Work object type, as defined in the conceptual model, is now linked to the Author and Publishing house object types through its Author and Publishing house attributes. These two object types - Author and Publishing house - therefore become sources of information that can be integrated into the Work object type. You have thus rendered explicit the connections that were defined in the conceptual model.
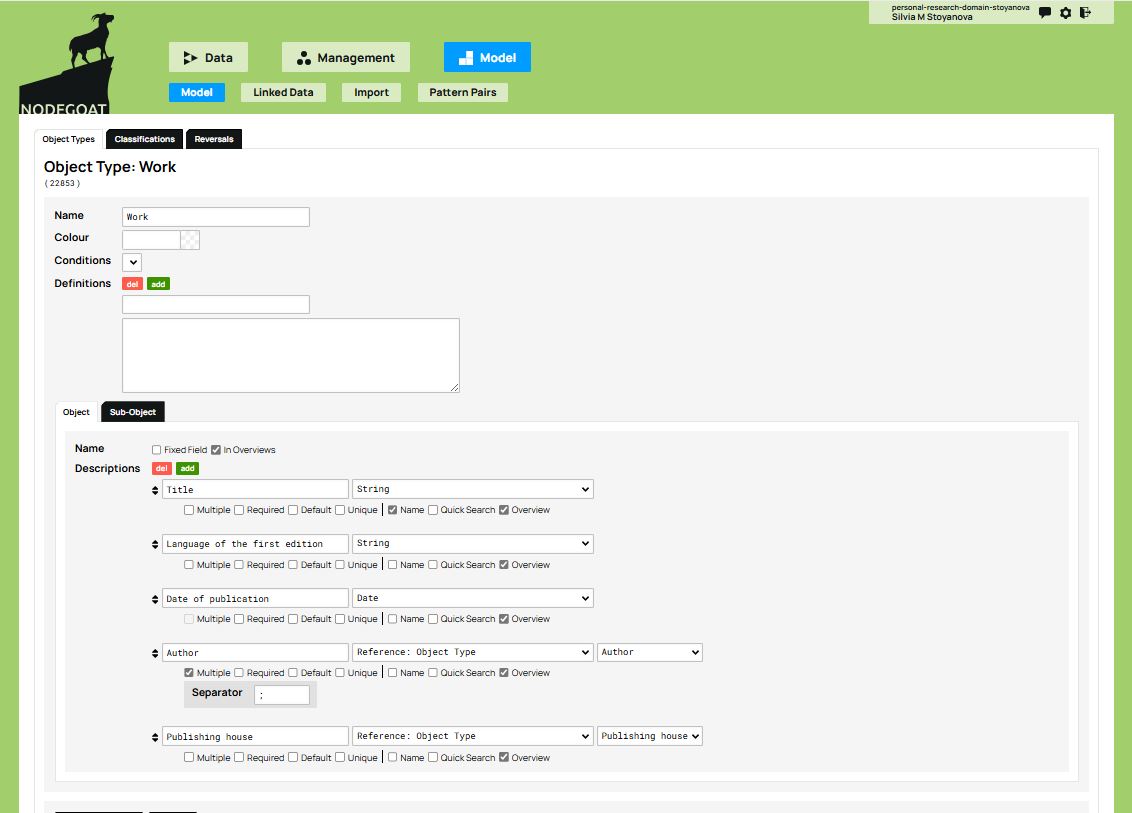
Figure 9. Connecting objects through the attributes Author and Publishing house by selecting the value ‘Reference: Object Type’ from the drop-down menu.
Next, you will need to check the box Multiple under the Author attribute, in order to indicate that some works can have more than one author, as is the case of The Intellectuals on the Road to Class Power. You will also need to select a symbol that nodegoat will use to separate multiple authors in the same box. The most commonly used separators are , or ; or else |, however make sure to check which data delimiter is selected for the tabular format when exporting the CSV file. If the same delimiter(s) also appears in the data, it may disrupt the structure of the exported file. For example, when a work has multiple authors, select the Multiple checkbox and choose a separator—such as semi-colon (;)—to separate the authors within the same cell. Make sure that this separator is different from the CSV field delimiter (usually a comma) when exporting your spreadsheet as a CSV file. In Excel or Google Sheets, choose File → Save As → CSV (Comma delimited) so columns are separated by commas, while each cell with multiple authors uses semi-colons to separate values within a cell.
Finally, when defining objects and their structures, you may be faced with uncertain historical information. The example of the book The Intellectuals on the Road to Class Power illustrates this case well because the exact founding date of Harvester Press publishing house is unknown. How should you handle a case like this? Since research indicates that this publisher was active during the 1970s, you can hypothesize that it was established sometime between the year 1970 and the year 1979 which is the year in which the book was published. nodegoat allows you to record temporal information as a time interval (called Chronology), which is particularly useful in these kinds of cases.
To do this, go back to the Model tab to access the Publishing house object type. Most likely, you defined the Founding date attribute in the same way as an author’s date of birth: under the Objects tab, in the Descriptions list, and by choosing the Date data type.
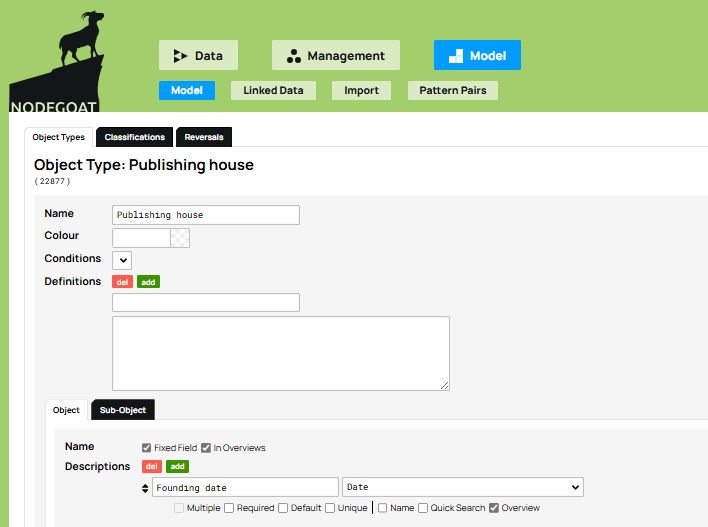
Figure 10. The Founding date attribute.
To enter a date as a time interval, you can use the Sub-Object tab. There, you create a sub-object called Founding date and check both the Date and Chronology options.
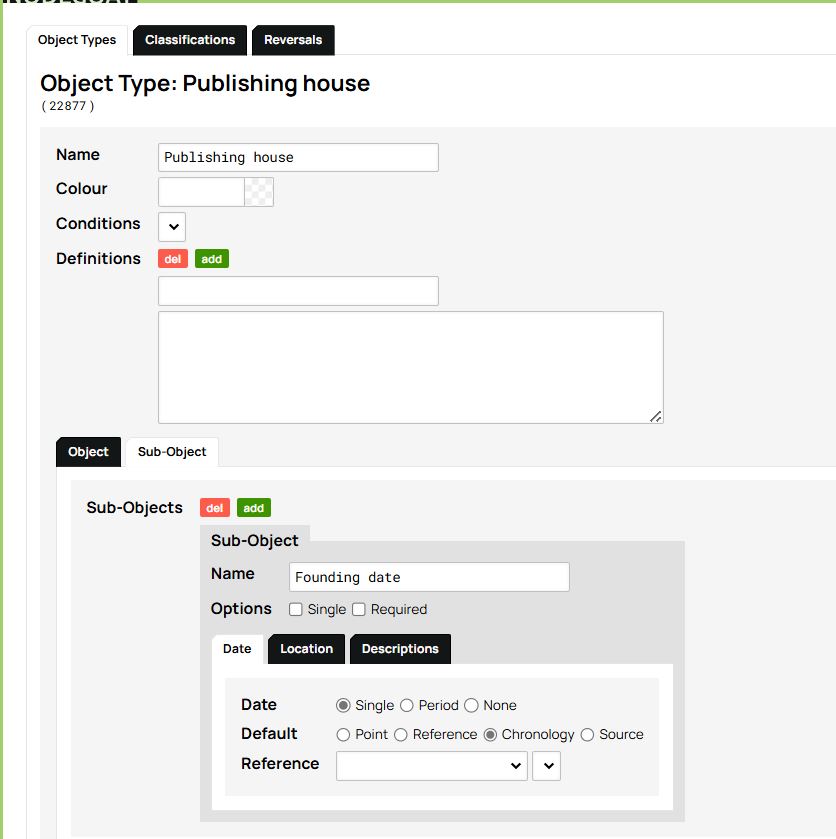
Figure 11. Creating a Chronology Sub-Object for the Publishing House type.
From now on, the Publishing house object type differs from Author and Work in that it now includes a new attribute that allows temporal information to be recorded as a time interval. Before continuing, you will need to remove the Founding date attribute from the Objects tab by deleting it from the descriptions field and saving the Object Type, since we have just replaced it with the Chronology Sub-Object.
Exploring and Using the Database
At this stage, the model, its object types, and their relationships have been defined. If you go to the Management tab and click on the project name, nodegoat creates a visualization of the model which, as you may notice, looks very similar to the original conceptual model:
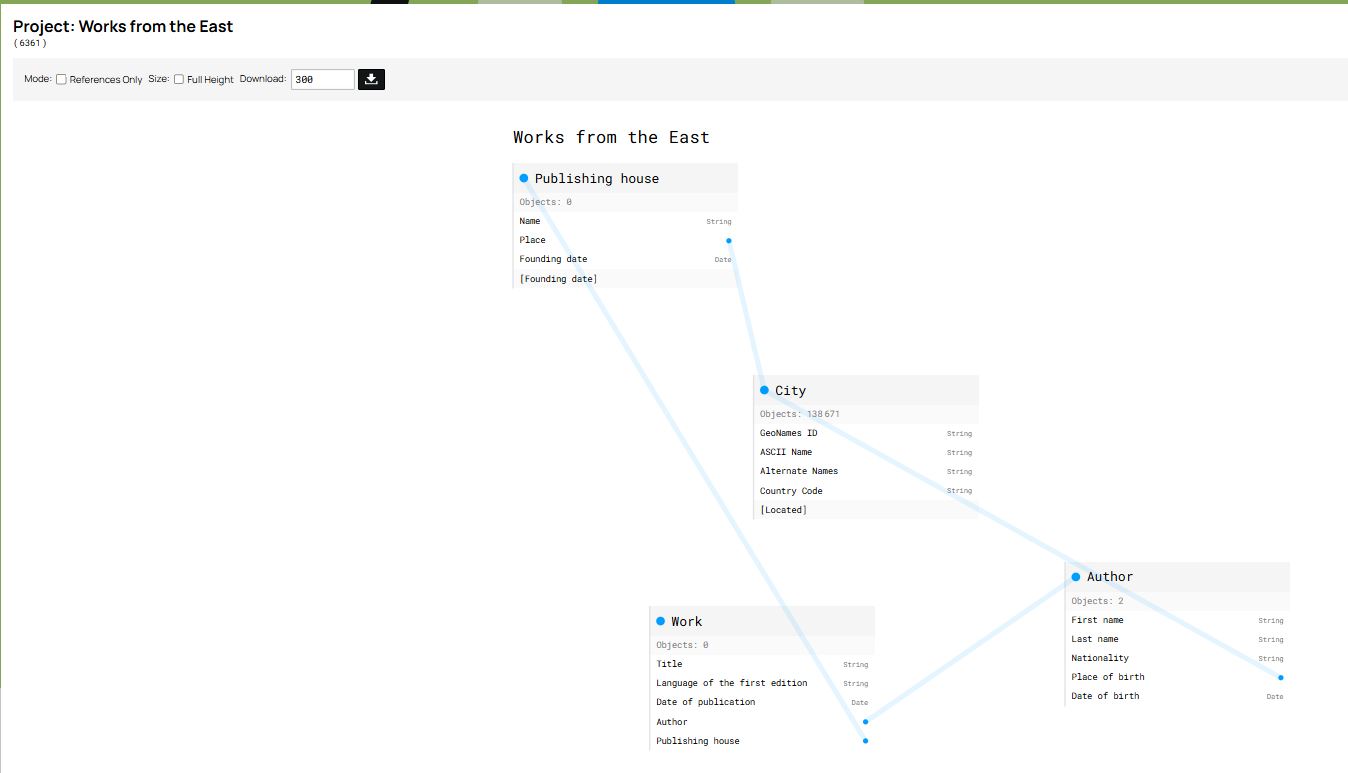
Figure 12. Visualization of the data model with nodegoat.
You can now manually populate the database with the information collected over the course of your research. To do this, go to the Data tab and click on the button Add [object type name] which appears below each object type as you click on it.
Note that the attribute Founding date of the Publishing house object type is not displayed with the other attributes, but instead appears as an element of the Sub-Objects, where its date is defined as Chronology. The software allows you to fill in the details of the chronology by choosing between three options from the drop-down menu which pops up when you click the green Create button below Chronology: 1) ‘Point’ to indicate an exact date; 2) ‘Statement’ to indicate a period after or before a certain date (year, month or day); 3) ‘Between Statements’ to indicate a period between two dates (as in our example, between 1970 and 1979).
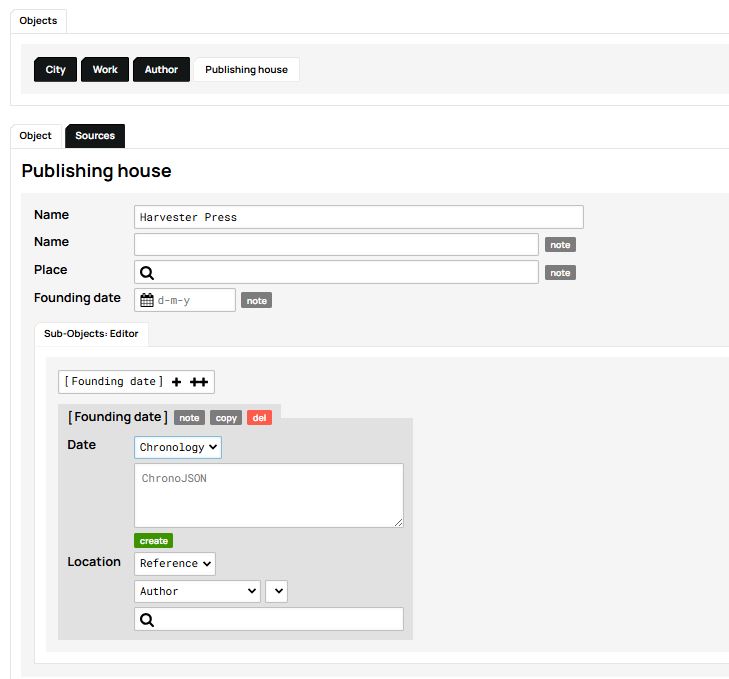
Figure 13. Creating a timeline for Harvester Press.
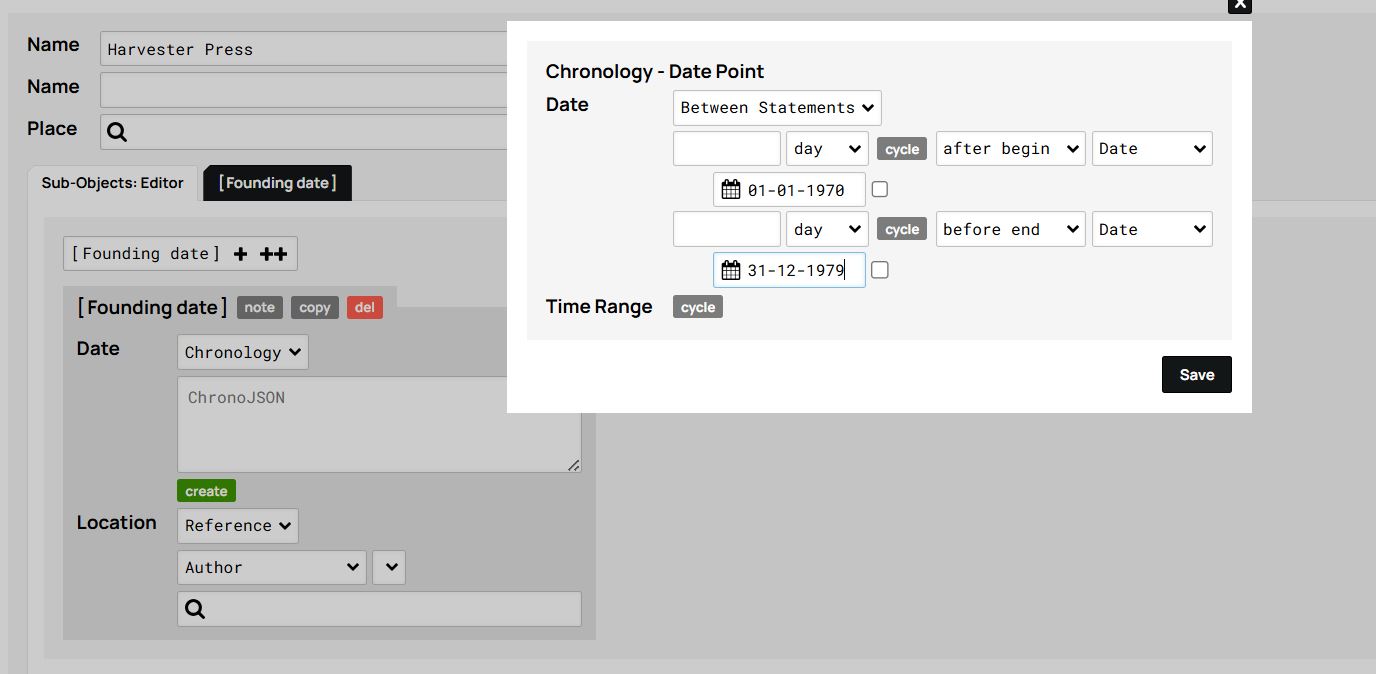
Figure 14. Example of a timeline defined as a period ‘Between Statements’.
Once you have recorded all the works, authors, and publishing houses, the database interface will appear as shown in the images below. From there, simply click on any item to access its associated information:
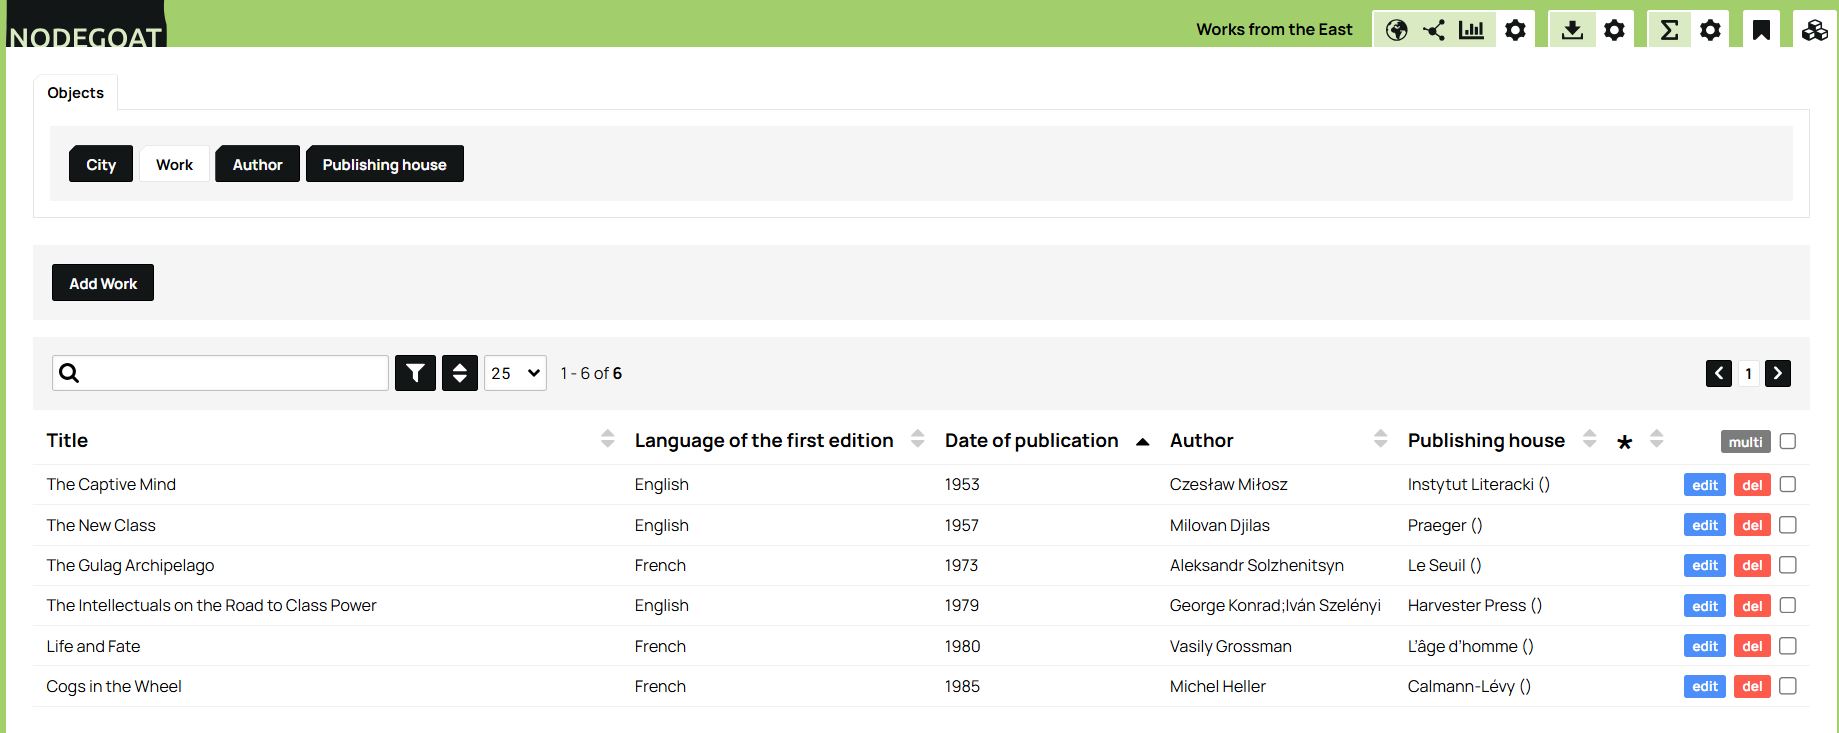
Figure 15. Overview of the works in our database.
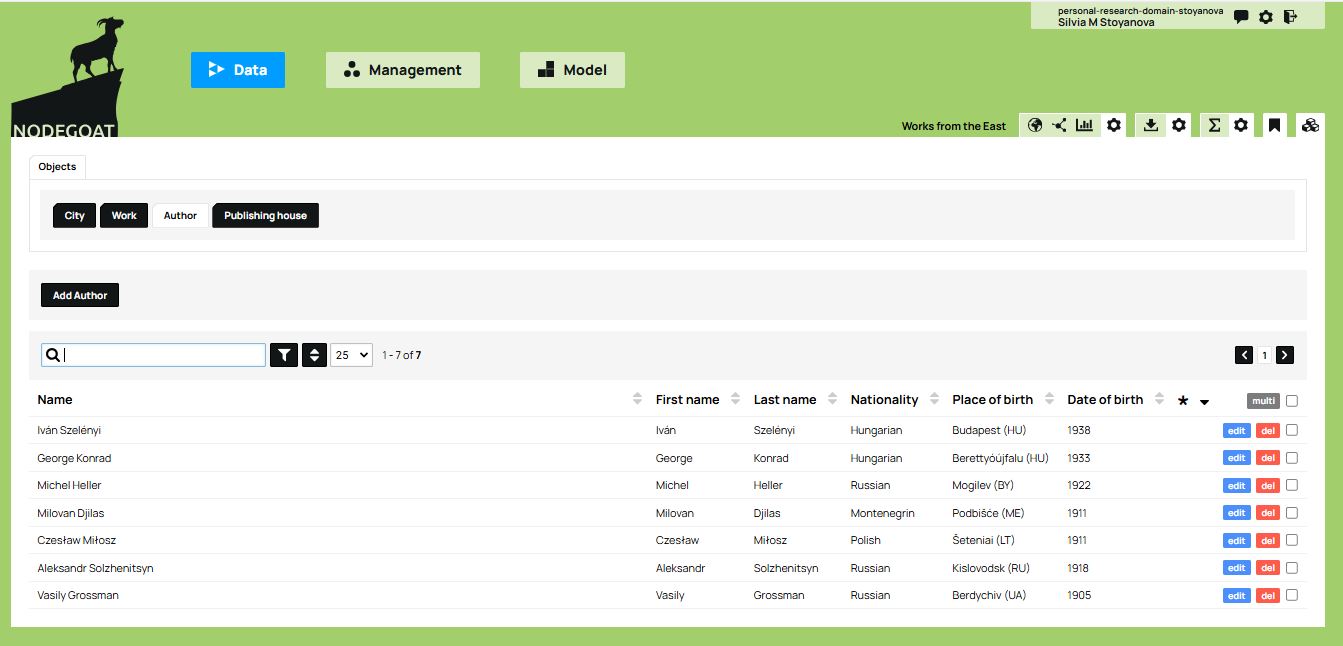
Figure 16. Overview of the authors in the database.
Alternatively, you can import an entire dataset as CSV files rather than manually entering each record one at a time. Please note, however, that there are specific procedures to follow when importing your data, especially when your data model includes relationships. For example, the identifiers in your CSV files need to match existing objects in the nodegoat model. In addition, when importing related object types, make sure you first import the ‘reference’ objects that other objects refer to (e.g., Publishing House or Author) and only afterwards import the objects that reference them (e.g., Work), so that nodegoat can create the relationships correctly. More information can be found in the nodegoat documentation.
Regardless of the method chosen (manual entry or importing files), once the database is built and populated, you can use the visualization tools offered by nodegoat to explore objects and their relationships further.
After selecting an Object Type in the Data tab, a set of visualization icons appears in the top right corner. These include options for geographical, relational (network), and chronological visualisations. For example, below is a map created using the geographical visualization tool which plots the birthplaces of the authors as blue dots. To create this map, select the Author Object type in the Data tab and click the icon for geographical visualization (the globe icon).
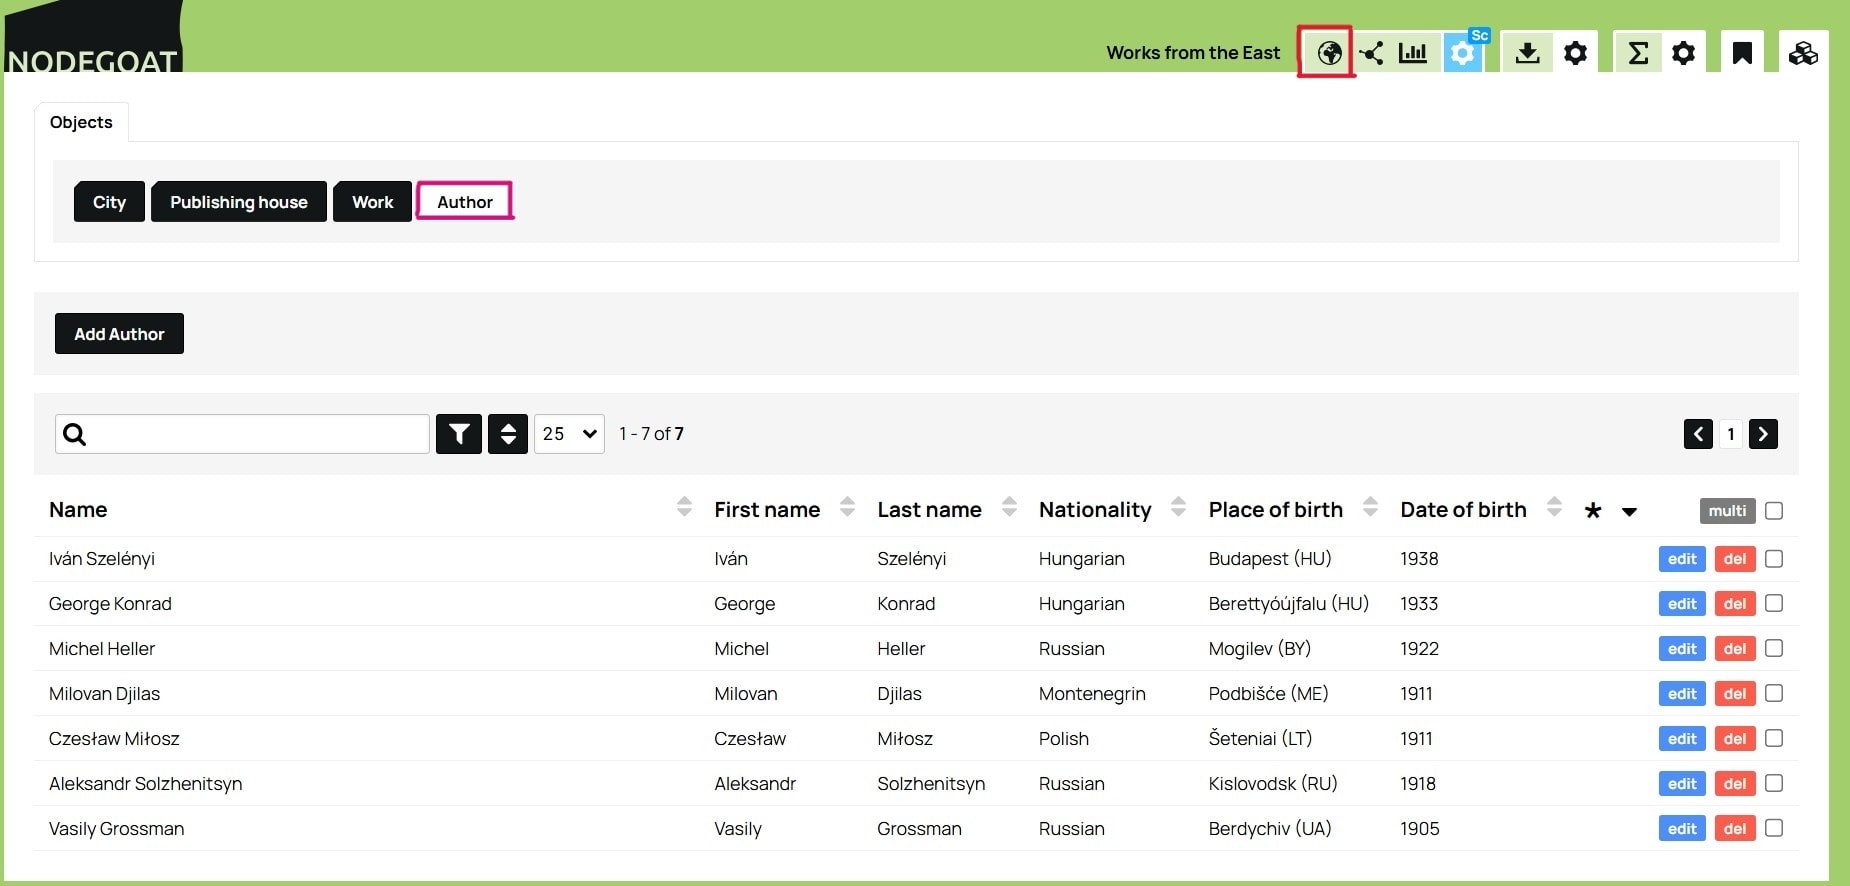
Figure 17. Overview of the authors in the database, indicating location of the Author Object type button (upper left), and location of the globe icon button (upper right).
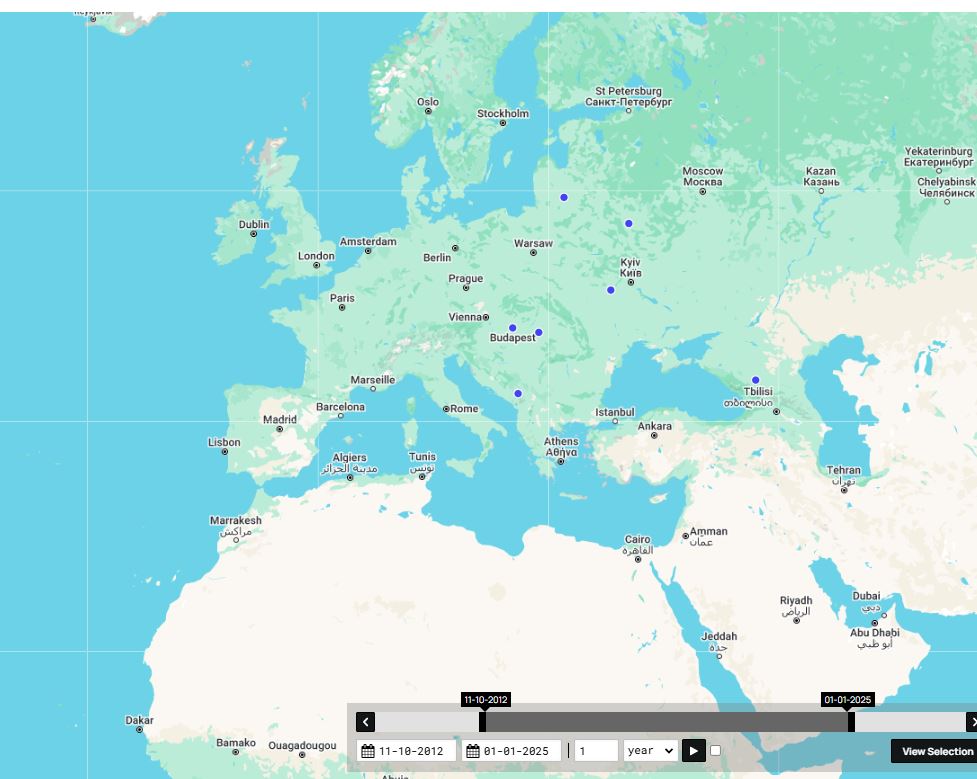
Figure 18. A geographical visualization in nodegoat of the birthplaces of the authors in our dataset.
In sum, nodegoat allows you to define a data model and build a database in a relatively simple way. It offers multiple possibilities for recording geographical and temporal information, while taking into account the uncertainty that often comes with the type of information collected in the humanities. In addition, nodegoat’s visualization tools allow you to consider the evolution of your research and identify certain tendencies. Finally, this research environment allows you to store and manage your data online, while also offering the possibility of saving or exporting it for analysis with other tools.
Conclusion
The aim of this lesson was to help researchers in the humanities conceptualize their research in terms of data by introducing them to the basics of modeling and building a database, which can often be a challenging task for novices. The lesson offered an entry point to using the online platform nodegoat, which is particularly well suited to the needs of newcomers to digital data management.
Of course, nodegoat also has some limitations: free individual access is limited to the development of a single project hosted on the platform’s servers. If you want to manage multiple projects, create multiple accounts, or host a project on a separate server, you will need to upgrade to a paid subscription. This often requires financial and/or technical support from a research or educational institution.
To learn more about nodegoat’s full potential, you are encouraged to explore the Guides prepared by the LAB1100 team, which provide detailed explanations of the platform’s features. On the nodegoat website, you can also explore other examples of data models suggested by the creators, as well as examples of historical research using databases.
References
-
Lemercier, Claire and Claire Zalc, Quantitative Methods in the Humanities: An Introduction. Translation by Arthur Goldhammer. Charlottesville: University of Virginia Press, 2019. ↩
-
Posner, Miriam, (2015), “Humanities Data: A Necessary Contradiction”, Miriam Posner’s Blog https://miriamposner.com/blog/humanities-data-a-necessary-contradiction/. ↩
-
Drucker, Johanna (2011), “Humanities Approaches to Graphical Display”, Digital Humanities Quarterly 5, n. 1. ↩
-
Thaller, Manfred (2018), “On Information in Historical Sources”, A Digital Ivory Tower, https://ivorytower.hypotheses.org/56. ↩
-
Gardarin, Georges (2003), Bases de données, Paris: Eyrolles. The book is freely accessible on the author’s website. For an English-language resource by the same author, see also: Gardarin, Georges and Patrick Valduriez, Relational databases and knowledge bases, Reading, Mass.; Wokingham: Addison-Wesley, 1989. ↩ ↩2
-
See this Wikipedia page for more detail on the notion of ‘cardinality’: ‘Relational Model’, https://en.wikipedia.org/wiki/Cardinality_(data_modeling). See also Gardarin, work cited above, 412-413. ↩
-
Bree, P. van, Kessels, G., (2013). nodegoat: a web-based data management, network analysis & visualisation environment, http://nodegoat.net from LAB1100. ↩ ↩2
-
The nodegoat version used to recreate the examples at the time of this translation is 8.4. ↩
-
The creators of nodegoat describe the relational approach of the software as ‘object-oriented’. Since this concept is most commonly used to describe a programming paradigm, we prefer to avoid the use of this term in order to avoid any confusion. ↩